An unsustainable development model
The period beginning with the Industrial Revolution witnessed an improvement in living standards unparalleled in human history. From 1850 to present, the global population has increased sixfold and global aggregate output has doubled, on average, every 25 years.
Unfortunately, this development occurred at the expense of a high environmental impact that today compromises the sustainability of the planet. As a result, the average global temperature and the degradation of the environment and ecosystems have increased.
The environmental crisis is already affecting economic activity and well-being. A clear example is the increase in the frequency and severity of external weather events. Therefore, to address this crisis, both mitigation policies that reduce the impact of human activity and adaptation policies that allow us to face the climate crisis with lower costs are required.
Human activity and global warming
Since the Industrial Revolution, the average global temperature has gradually risen to 1.2 °C above pre-industrial times (1850-1900). Scientific evidence has shown that this warming is caused by the emission of greenhouse gases (GHGs) resulting from human activity. Indeed, since 1850, emissions of CO2, the main GHG, have increased more than 14-fold1 (figure 4.1).
Figure 4.1 Evolution of emissions and global temperatures
A. Global surface temperature evaluated in relation to cumulative CO2 emissions
B. Cumulative CO2 emissions since 1850 (gigatons)
CO2 emissions in figure 4.1 are grouped into two major components: those associated with land use, land-use change and forestry (LULUCF, hereafter), and those associated with fossil consumption and industrial processes (FCIP, hereafter). The importance of these two components has varied over time.
Between 1850 and 1900, the LULUCF component accounted for more than 90 % of total global CO2 emissions. However, this component has lost weight in the face of the growing importance of fossil energy. Today, about four-fifths of global emissions come from fossil fuel consumption and industrial processes.
In 2019, per capita emissions in Latin America and the Caribbean were similar to the global average and represented less than 80 % of the value corresponding to developed countries and less than half compared to North America. Inequality in emissions responsibility is also manifested according to socioeconomic level: the first global income decile emitted the same as the remaining 9 deciles, 4 times more than the poorest half of the global population; meanwhile, the top percentile emitted a quarter of global emissions (Chancel, 2022).
Rich countries are the ones that emit the most, the ones that contribute the most to the problem [of global warming] and, on the other hand, the countries most exposed [to the consequences] are those that are, in fact, poor. Therefore, a question of justice must be an integral part of the climate discussion.
Based on an interview with Juliano Assunção
The real problem is climate change. […] And Trinidad and Tobago, in particular, is in a not-so-pleasant situation. […] Emissions are high on a per capita basis because our population is only 1.3, 1.4 million. […] Even though our emissions per capita are high, the amount is almost undetectable.
Based on an interview with Colm Imbert
Although this is relevant when it comes to introducing elements of climate justice into the discussion on mitigation efforts, it does not exempt any country or region from making the necessary efforts to keep global temperatures at appropriate levels. It would not be enough for developed countries alone to make efforts to stop global warming, given that 75 % of current emissions come from middle and low-income countries.
Human activity and degradation of the environment and ecosystems
The degradation of the environment and ecosystems by human activity is associated with four causes in addition to climate change: land-use change, overexploitation, introduction of invasive species, and pollution (Purvis et al., 2019).
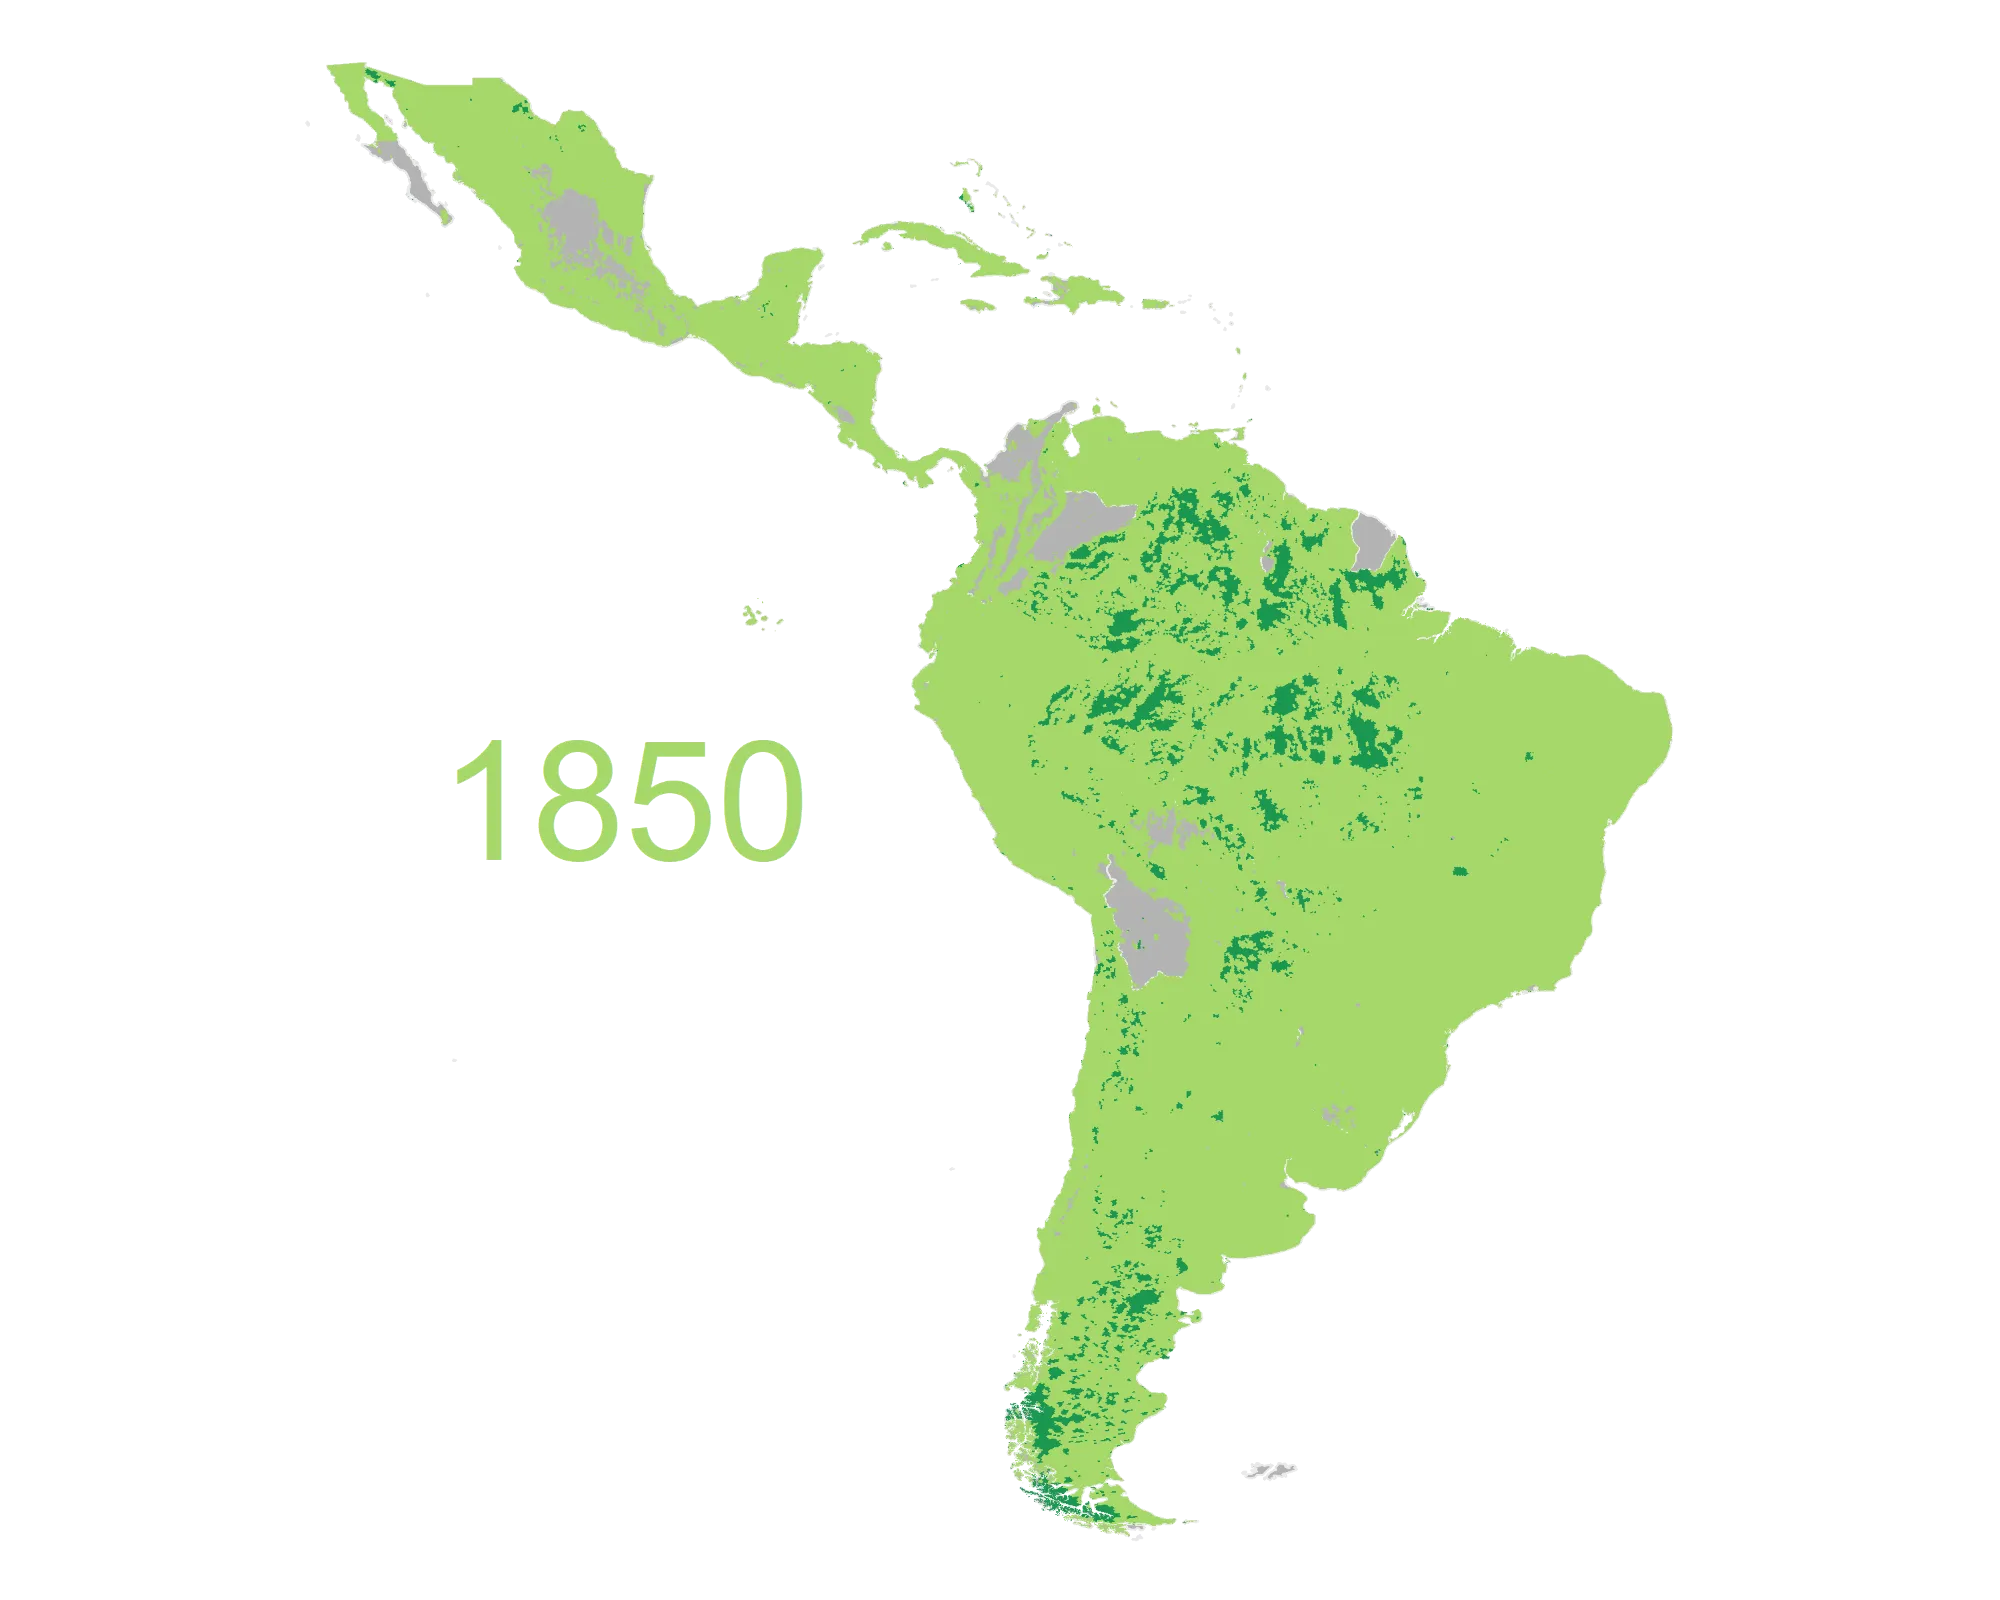
With respect to land use, by 1850, less than 4 % of the region’s surface was significantly modified by human presence. In contrast, Europe (excluding Russia), by this date, presented modifications in about 40 % of its surface. For the most recent year with data (2017), the fraction of the soil with low or no transformations is around 45 % in the region, closer to 32 % in Europe (without Russia). This measure, however, varies significantly between subregions: in South America it reaches 47 %, while in Mesoamerica and the Caribbean it is 27 % and 17 %, respectively (see figure 4.2).
Land use change is strongly linked to the agricultural sector, especially in the region, where it has a high share of gross domestic product (GDP). By 2017, 35 % of the region’s land area was devoted to pasture, the lowest intensity use, and 16 % to crops. In the Caribbean subregion, only 8 % was dedicated to grazing, while 35 % was dedicated to crops.
Finally, urban use and infrastructure placement, represented by the settlements category, constituted a comparatively smaller fraction of the area used in the region as a whole (4.4 %), although it accounted for 38 % of the area of the Caribbean countries. This land use is associated with the most profound transformation of the ecosystems in which it is located2.
Figure 4.2 Land use
Coberturas naturales y seminaturales en 1850
The second cause of environmental degradation is overexploitation, that is, the excessive extraction of natural resources, exceeding their regenerative capacity. The fishing industry, tourism and the extraction of timber resources experience this problem.
The third cause is the introduction of invasive species of plants, animals or microorganisms that alter the balance of ecosystems and can seriously damage their biodiversity. Pastoral land use, for example, involves the introduction of foreign grassland species that offer greater productivity under local climatic conditions. In general, these species can expand beyond the regions dedicated to production, competing with native plant species and altering natural fire cycles.
The fourth cause is air, water and soil pollution. This is a negative externality that affects human well-being through the degradation of ecosystems and the services they provide, and through its direct impact on health. The sectors or activities most frequently linked to pollution are hydrocarbon extraction and processing, mining and the agricultural sector. Cities are also an environment prone to pollution problems.
Ecosystem degradation is manifested in the loss of flora and fauna, both in terms of diversity (number of species) and population. The Living Planet Index shows a significant deterioration, especially in the Latin American and Caribbean region, where there has been a decline of more than 90 % since 1970.
Figure 4.3 Living Planet Index, by region
Impacts of climate change and ecosystem degradation
Global warming has increased the frequency and intensity of some extreme weather events such as floods, storms, droughts, forest fires and cyclones. In Latin America and the Caribbean, the number of such events increased from 28 per year in the last two decades of the 20th century to more than 53 in the first two decades of the 21st century. The number of people affected rose from 4.5 million per year to more than 7 million (figure 4.4).
Figure 4.4 Occurrence of climate-related extreme weather events and people affected in Latin America and the Caribbean
A. Number of events
B. People affected
Unfortunately, these events have such significant social and economic costs that they even transcend generations. Caruso (2017) explores the consequences of natural disasters that occurred during the twentieth century in the region. In his results, he finds, for example, that suffering a flood as a fetus is associated with 0.47 fewer years in education, a 10 % higher probability of being unemployed and a reduction in labor income of about 12 %.
[The Caribbean islands] invariably find themselves as some of the biggest, if not the biggest, victims of climate change. When a hurricane strikes, it’s us. There is nowhere to evacuate to. Your GDP is destroyed in fractions of a second, with multiplications of 100 %, 200 %, literally gone in a few hours, and very little can be done about it. This is really challenging for small states.
Based on an interview with Karen-Mae Hill
Natural disasters also impact infrastructure, a key driver of growth and inclusion. Droughts and changing rainfall patterns can also compromise agricultural production. For example, southern Latin America has just experienced the worst drought since 1944, according to the World Meteorological Organization. It is estimated that this episode could cost between 2 % and 5 % of GDP in Argentina, Brazil, Paraguay and Uruguay, mainly due to the negative impacts on the agricultural, livestock and energy sectors (Perelmuter, 2023).
The deterioration of ecosystems reduces the value of the services they provide, which are classified into four groups: (i) provisioning services, referring to the set of physical materials that people obtain from nature; (ii) regulating services, which include temperature moderation, water cycle regulation and air purification, among others; (iii) cultural or non-material services, which contemplate the aesthetic and recreational value of nature; and (iv) supporting services, referring to the processes that are necessary for all other ecosystem services and human life to be possible, including oxygen production (Millennium Ecosystem Assessment, 2005).
Although economic activity tends to privilege provisioning services that have a market value, other services, which are more difficult to quantify and appropriate, are also essential. Tourism depends crucially on the aesthetic value of paradigmatic ecosystems in the region (cultural or non-material ecosystem services), such as the Caribbean beaches or the Amazon rainforest, while urban economic activity benefits from regulating services through the moderation of temperatures by vegetation. It also benefits from regulating services by depositing its wastes, where ecosystems intervene in the purification of air, soil and water.
Pollution, in particular, is a manifestation of environmental degradation with significant incidence in the region (AMAP and UNEP, 2019). Figure 4.5 shows the components associated with environmental health reported by the Environmental Protection Index (Block et al., 2024). The data reveal that, on average, the countries of the region present indicators significantly lower than those observed in OECD countries.
Figure 4.5 Selected Environmental Health Indicators EPI
There is abundant evidence of the welfare effects of pollution. Some analyses focus on air pollution caused by fossil fuels. For example, Rivera et al. (2024) provide evidence for Chile, where the expansion of solar power generation capacity was associated with a reduction in hospital admissions due to respiratory diseases.
There is robust evidence of acute episodes of ecosystem degradation that negatively impact human health. For example, impacts caused by vegetation loss due to the role of vegetation in improving air quality (Jones and McDermott, 2018), and by sudden reductions in populations of vultures and amphibians that are important for disease vector control (Frank and Sudarshan, 2024; Springborn et al., 2022).
In addition, there is evidence of the negative impact on economic activity caused by the loss of key pest control species on agricultural production (Frank et al., 2024). Frank (2024) documents a one-third increase in pesticide use caused by the reduction of bat populations, and a consequent increase in infant mortality of 8 %.